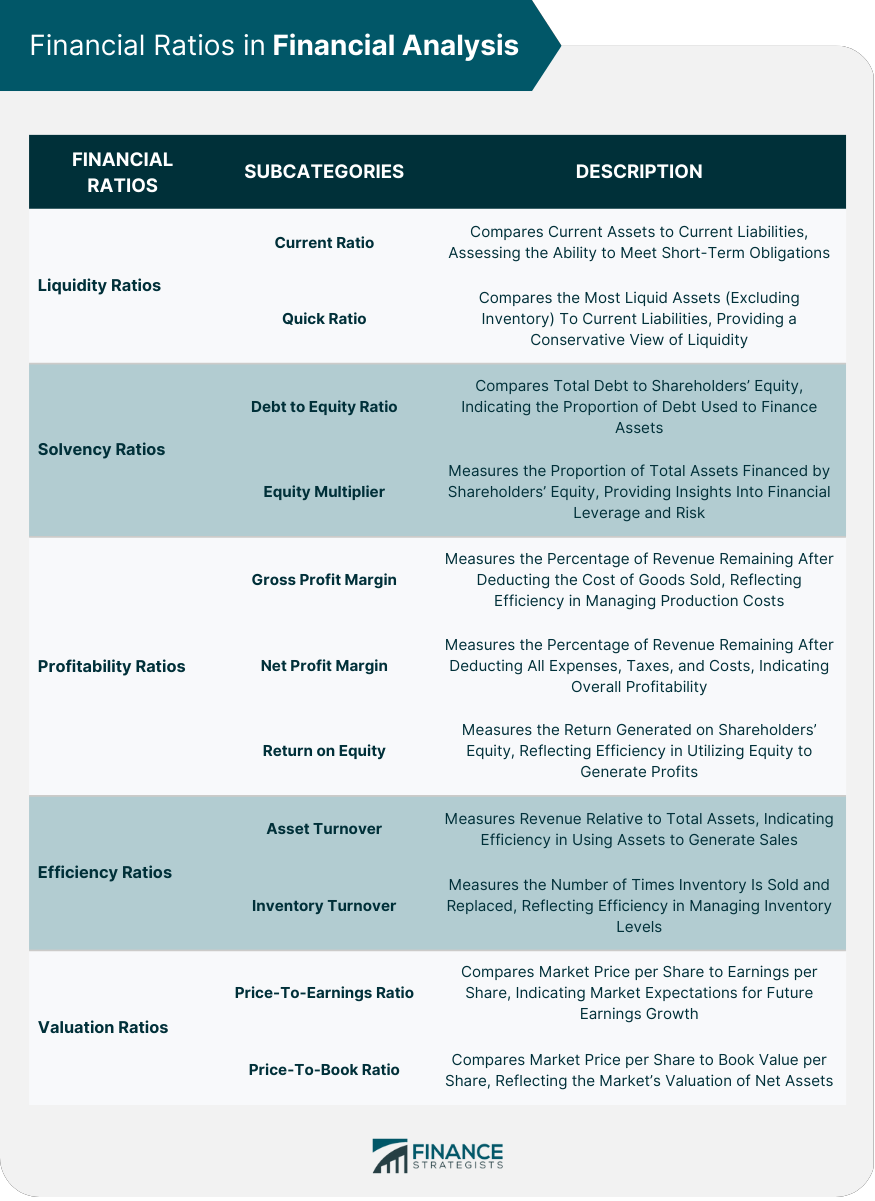
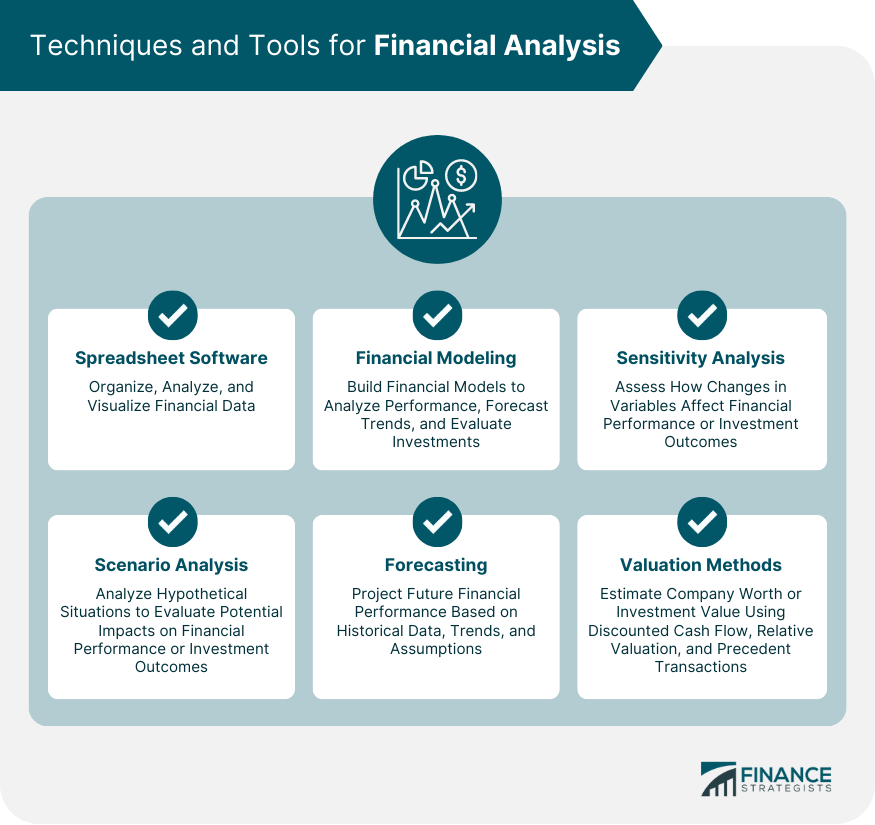
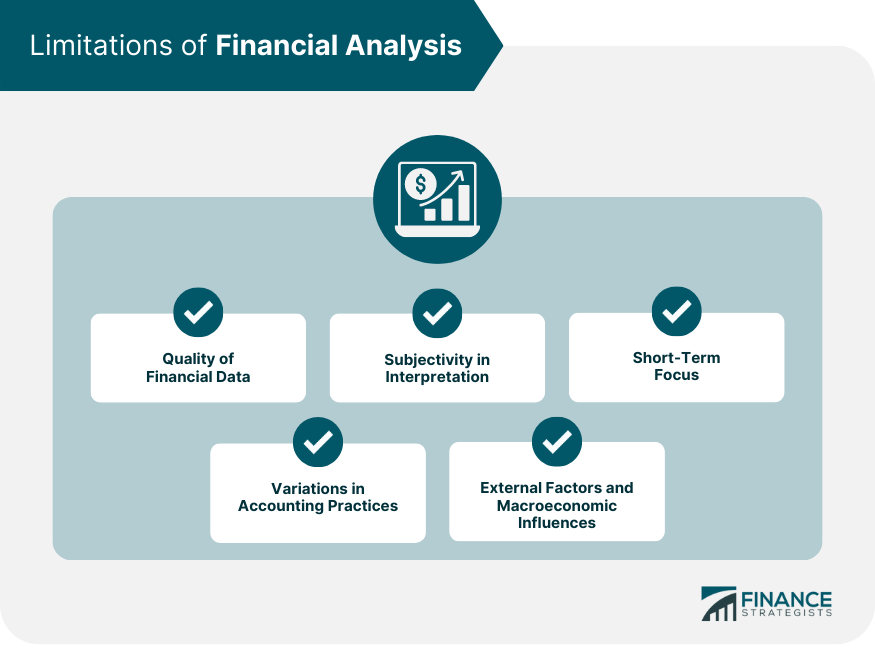
Financial analysis is the systematic examination of a company's financial statements, ratios, and other relevant data to evaluate its financial performance, identify strengths and weaknesses, and make informed decisions about investments, business operations, and financing activities. Financial analysis plays a critical role in decision-making, as it helps investors, management, and other stakeholders identify trends, assess a company's financial stability, and determine its growth potential. It also enables businesses to optimize resource allocation, improve operational efficiency, and enhance overall profitability. Stakeholders who benefit from the financial analysis include investors, management, creditors, regulatory authorities, and employees. There are several types of financial analysis, each serving different purposes and providing unique insights into a company's financial performance. Horizontal analysis, also known as trend analysis, involves comparing financial data over multiple reporting periods to identify trends, patterns, and growth rates. This analysis helps in understanding the company's historical performance and anticipating future trends. Vertical analysis, or common-size analysis, involves comparing each line item in a financial statement to a base number (usually total revenue or total assets) to determine the relative importance of each item. This approach enables stakeholders to compare financial performance across companies or industries, irrespective of their size. Ratio analysis involves calculating financial ratios using data from financial statements to assess a company's liquidity, solvency, profitability, efficiency, and valuation. These ratios help in comparing a company's performance against industry standards, competitors, or historical data. Cash flow analysis examines a company's cash inflows and outflows, providing insights into its liquidity position, working capital management, and overall financial health. This analysis is crucial for understanding a company's ability to meet its short-term obligations and invest in growth opportunities. Trend analysis iinvolves examining historical data and patterns to identify and analyze trends in financial performance and key metrics. By understanding trends, financial analysts can gain insights into a company's financial health, forecast future performance, and make informed investment or business decisions. Benchmarking is the process of comparing a company's financial performance, ratios, and practices with those of its competitors or industry standards. This analysis helps identify areas for improvement and set realistic performance targets. Financial statements are the primary source of information for financial analysis. They provide a comprehensive view of a company's financial position and performance. The balance sheet presents a company's assets, liabilities, and shareholder's equity at a specific point in time. It offers insights into a company's liquidity, solvency, and financial stability. The income statement, also known as the profit and loss statement, reports a company's revenues, expenses, and net income over a specified period. It helps stakeholders assess a company's profitability and operational efficiency. The statement of cash flows tracks a company's cash inflows and outflows across operating, investing, and financing activities during a specified period. It offers insights into a company's cash management, liquidity, and overall financial health. The statement of changes in equity displays the movement in a company's equity accounts, including share capital, retained earnings, and other reserves, over a specified period. It helps stakeholders understand how a company's financial position has evolved over time. The notes to the financial statements provide additional information and explanations about the items presented in the financial statements. They offer valuable insights into a company's accounting policies, contingencies, and other relevant details that help stakeholders better understand the company's financial performance and position. Financial ratios are essential tools for evaluating a company's financial performance and position. They provide a standardized approach for comparing companies across industries and time periods. Liquidity ratios measure a company's ability to meet its short-term obligations and maintain its day-to-day operations. The current ratio compares a company's current assets to its current liabilities, assessing its ability to meet short-term obligations. The quick ratio, also known as the acid-test ratio, compares a company's most liquid assets (excluding inventory) to its current liabilities. It offers a more conservative view of a company's liquidity position. Solvency ratios assess a company's ability to meet its long-term obligations and remain financially stable over time. The debt-to-equity ratio compares a company's total debt to its shareholders' equity, indicating the proportion of debt used to finance the company's assets. The equity multiplier measures the proportion of a company's total assets financed by shareholders' equity, providing insights into its financial leverage and risk profile. Profitability ratios evaluate a company's ability to generate profits relative to its revenues, assets, and equity. The gross profit margin measures the percentage of revenue remaining after deducting the cost of goods sold, reflecting a company's efficiency in managing production costs. The net profit margin measures the percentage of revenue remaining after deducting all expenses, taxes, and costs, indicating a company's overall profitability. The return on equity (ROE) measures the return generated on shareholders' equity, reflecting a company's efficiency in utilizing its equity to generate profits. Efficiency ratios evaluate a company's ability to utilize its assets and resources effectively. The asset turnover ratio measures a company's revenue relative to its total assets, indicating its efficiency in using assets to generate sales. The inventory turnover ratio measures the number of times a company's inventory is sold and replaced during a specified period, reflecting its efficiency in managing inventory levels. Valuation ratios help investors assess a company's worth and potential investment attractiveness. The price-to-earnings (P/E) ratio compares a company's market price per share to its earnings per share, indicating the market's expectations for the company's future earnings growth. The price-to-book (P/B) ratio compares a company's market price per share to its book value per share, reflecting the market's valuation of the company's net assets. Several techniques and tools are available to facilitate effective financial analysis. Spreadsheet software, such as Microsoft Excel or Google Sheets, is widely used for organizing, analyzing, and visualizing financial data. Financial modeling involves building financial models to analyze a company's performance, forecast future trends, and evaluate investment opportunities. Sensitivity analysis assesses how changes in specific variables affect a company's financial performance or investment outcomes, helping stakeholders identify and manage risks. Scenario analysis involves analyzing different hypothetical situations or assumptions to evaluate their potential impact on a company's financial performance or investment outcomes. Financial forecasting involves projecting a company's future financial performance based on historical data, trends, and assumptions, helping stakeholders plan and make informed decisions. Valuation methods, such as discounted cash flow, relative valuation, and precedent transactions, are used to estimate a company's worth or the value of an investment opportunity, aiding stakeholders in making investment decisions. Financial analysis is employed in various contexts, serving multiple purposes and stakeholders. Financial analysis is crucial for evaluating a company's performance, identifying areas for improvement, and setting performance targets. Investors use financial analysis to assess the attractiveness of investment opportunities, determine potential risks and rewards, and make informed decisions. Creditors and lenders use financial analysis to evaluate a borrower's creditworthiness and ability to repay loans, helping them make informed lending decisions. Financial analysis plays a vital role in mergers and acquisitions, as it helps stakeholders assess the financial health and synergies of the companies involved, enabling them to make strategic decisions. The financial analysis aids businesses in financial planning, budgeting, and resource allocation, ensuring the efficient use of resources and alignment with strategic goals. While financial analysis is a powerful tool, it has certain limitations that stakeholders must consider when interpreting results and making decisions. The accuracy and reliability of financial analysis depend on the quality of the financial data used. Inaccurate or outdated data can lead to misleading conclusions and poor decision-making. Financial analysis involves interpreting data and making assumptions, which can be subjective and influenced by the analyst's biases, potentially affecting the analysis's validity. Differences in accounting policies, practices, and regulations across companies, industries, and countries can make it challenging to compare financial data and draw meaningful conclusions. Financial analysis often focuses on short-term performance, which may not accurately reflect a company's long-term prospects or potential risks. The financial analysis primarily focuses on a company's financial data, potentially overlooking external factors, such as macroeconomic trends, industry dynamics, and geopolitical events, that can significantly impact a company's performance. Financial analysis is a systematic examination of a company's financial statements, ratios, and other relevant data to evaluate its financial performance, identify strengths and weaknesses, and make informed decisions about investments, business operations, and financing activities. Financial analysis plays a critical role in decision-making, helping investors, management, and other stakeholders identify trends, assess a company's financial stability, and determine its growth potential. Stakeholders benefitting from financial analysis include investors, management, creditors, regulatory authorities, and employees. Different types of financial analysis include horizontal analysis, vertical analysis, ratio analysis, cash flow analysis, trend analysis, and benchmarking. Financial analysis is useful in various contexts, such as business performance evaluation, investment decision making, credit analysis and lending decisions, mergers and acquisitions, and financial planning and budgeting. However, financial analysis has limitations, including quality of financial data, subjectivity in interpretation, variations in accounting practices, short-term focus, and external factors and macroeconomic influences. Continuous learning and staying updated with industry trends are crucial for effective financial analysis in a constantly evolving business environment.Definition and Purpose of Financial Analysis
Importance in Decision Making
Key Stakeholders
Types of Financial Analysis
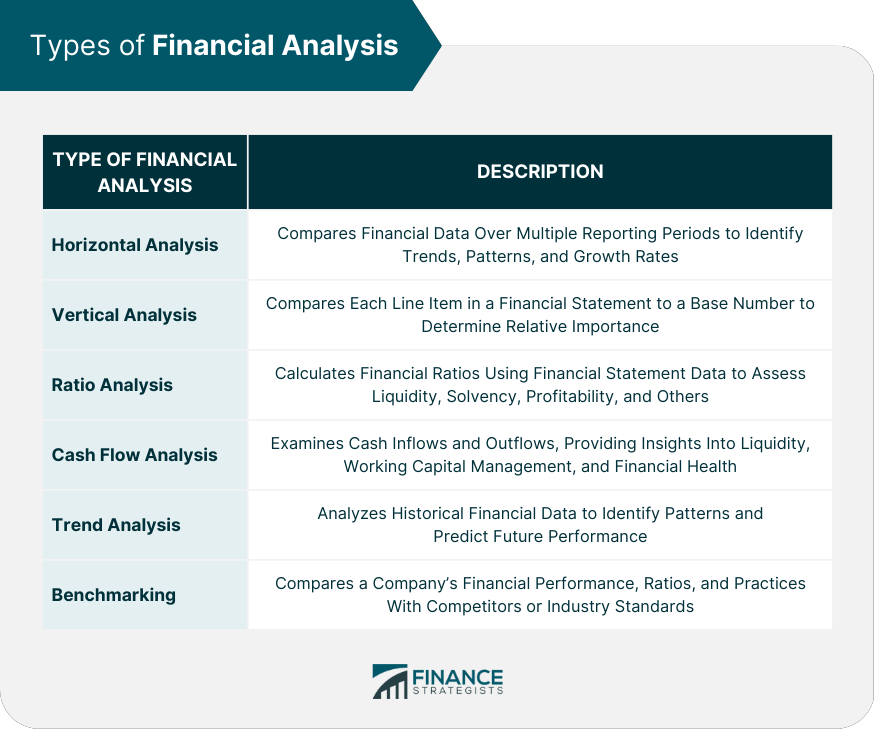
Horizontal Analysis
Vertical Analysis
Ratio Analysis
Cash Flow Analysis
Trend Analysis
Benchmarking
Financial Statements
Balance Sheet
Income Statement
Statement of Cash Flows
Statement of Changes in Equity
Notes to the Financial Statements
Financial Ratios
Liquidity Ratios
Current Ratio
Quick Ratio
Solvency Ratios
Debt-To-Equity Ratio
Equity Multiplier
Profitability Ratios
Gross Profit Margin
Net Profit Margin
Return on Equity
Efficiency Ratios
Asset Turnover
Inventory Turnover
Valuation Ratios
Price-To-Earnings Ratio
Price-To-Book Ratio
Techniques and Tools for Financial Analysis
Spreadsheet Software
Financial Modeling
Sensitivity Analysis
Scenario Analysis
Forecasting
Valuation Methods
Applications of Financial Analysis
Business Performance Evaluation
Investment Decision Making
Credit Analysis and Lending Decisions
Mergers and Acquisitions
Financial Planning and Budgeting
Limitations of Financial Analysis
Quality of Financial Data
Subjectivity in Interpretation
Variations in Accounting Practices
Short-Term Focus
External Factors and Macroeconomic Influences
Conclusion
Financial Analysis FAQs
Financial analysis is the systematic evaluation of a company's financial performance and position using financial statements, ratios, and other relevant data. It helps investors, management, and stakeholders make informed decisions about investments, business operations, and financing activities.
Financial analysis can identify a company's strengths and weaknesses, enabling management to address areas for improvement, optimize resource allocation, and enhance operational efficiency. By regularly monitoring financial ratios and trends, businesses can make data-driven decisions that promote growth and profitability.
The key financial statements used in financial analysis include the balance sheet, income statement, statement of cash flows, and statement of changes in equity. These statements provide a comprehensive view of a company's financial position and performance, allowing stakeholders to assess its financial health and make informed decisions.
The main types of financial analysis techniques include horizontal analysis, vertical analysis, ratio analysis, cash flow analysis, trend analysis, and benchmarking. Each technique serves different purposes and provides unique insights into a company's financial performance, helping stakeholders make informed decisions.
The limitations of financial analysis include the quality of financial data, subjectivity in interpretation, variations in accounting practices, short-term focus, and external factors and macroeconomic influences. Stakeholders should consider these limitations when interpreting results and making decisions, adopting a holistic approach that incorporates external factors and qualitative information for a comprehensive assessment.
True Tamplin is a published author, public speaker, CEO of UpDigital, and founder of Finance Strategists.
True is a Certified Educator in Personal Finance (CEPF®), author of The Handy Financial Ratios Guide, a member of the Society for Advancing Business Editing and Writing, contributes to his financial education site, Finance Strategists, and has spoken to various financial communities such as the CFA Institute, as well as university students like his Alma mater, Biola University, where he received a bachelor of science in business and data analytics.
To learn more about True, visit his personal website or view his author profiles on Amazon, Nasdaq and Forbes.