Trailing Twelve Months is a phrase used to indicate the previous 12 consecutive months of a company's financial data, leading up to the time that a report of that data is generated. It does not have to align directly with the ending of a fiscal year, though sometimes it can. While previous fiscal year used for tax and accounting purposes, the TTM abbreviation refers to the prior 12 month period up through the most recently updated financial records. Analysts often utilize TTM data as it is the best way to take an annualized view of the performance of a company over a sustained period of time. TTM accounts for both seasonality and other time-specific effects on a company's operation that could have a greater effect on a short-term financial analysis. TTM data is often used in things like balance sheets, income statements and cash flow charts. TTM is often used to format financial data and formulate finance-related ratios. It is especially handy because it can provide more recent data tied to a certain point in time. This does not have to correspond to the end of a quarter or a fiscal year while remaining annualized, accounting for seasonality or short-term abnormalities in things like supply, demand and operating costs. Companies often use running TTM tallies to perform internal financial evaluations. These evaluations can include calculating key performance indicators such as net profit margin or liquidity. They can also be used to look at year-over-year trends such as revenue growth. TTM Revenue, for example, indicates the amount of revenue that a company has earned over the trailing twelve months. This is a key indicator which can determine whether a company is experiencing growth, and if so, where that growth is coming from. TTM Revenue does have some limitations, though. It cannot determine profit, a company's ability to turn said profit, or its capability to generate gross revenue. Thus, some analysts often overlook this metric in order to focus more on profitability. However, it can still be vital in determining the strengths and weaknesses of a company's revenue-generating practices. The easiest way to calculate data from the trailing 12 months is to add by the previous four quarters, the three-month periods into which the fiscal year is broken up. Start with the most recent quarter--for instance, to make a TTM calculation in July 2020, one would begin with Q2, which ended in June 2020. Then, simply go back and add on the three preceding quarters. The formula for TTM is: Trailing 12 Months = Q (most recent) + Q (1 quarter ago) + Q (2 quarters ago) + Q (3 quarters ago) Here is an example of the trailing 12 months revenue for a company if the most recently completed quarter of a company is Q1 of 2021: Q1 of 2021: $10 million Q4 of 2020: $12 million Q3 of 2020: $9 million Q2 of 2020: $9 million The trailing 12 months revenue for this company is $40 million. There is another, slightly more complicated TTM formula, but it is used more frequently because it is better adapted to the tools and datasets most commonly at an analyst's disposal. This formula starts with a company's annual financial report, then adds the reports for any quarters following the annual report, then subtracts the corresponding quarterly from the annual report. The advanced formula for TTM is: Trailing 12 Months = Most Recent Quarter(s) + Most Recent Year - The Corresponding Quarter(s) 12 Months Before the Most Recent Quarter(s) Here is what that would look like to calculate the TTM for July 2020 under this method: This TTM equation is often easier for analysts to perform and provides a better look at year-over-year data for a certain period of time. The TTM format is used often in the Earnings per Share metric, which calculates a company's profit by the outstanding shares of its stock. Earnings per Share, or EPS, is valued by analysts as a key indicator of the overall profitability of a company. It is calculated by dividing the net income of a company by its available shares. The trailing 12 months of Earnings per Share can show how a company is maintaining its profits over a sustained period of time. Additionally, the TTM data of EPS is a key factor in determining a company's price to earnings ratio, which shows how profitable each individual stock of a company is. A company's P/E ratio is calculated by dividing its individual stock price by its earnings per share over the trailing 12 months. In conclusion, TTM is used because it is a useful time frame to state financial metrics. The prior fiscal year may be used instead of the trailing twelve months, but using the trailing twelve months allows for more up-to-date financial metrics.What Does TTM Mean?
TTM On Financial Statements
Why Use TTM
TTM Limitations
How to Calculate TTM
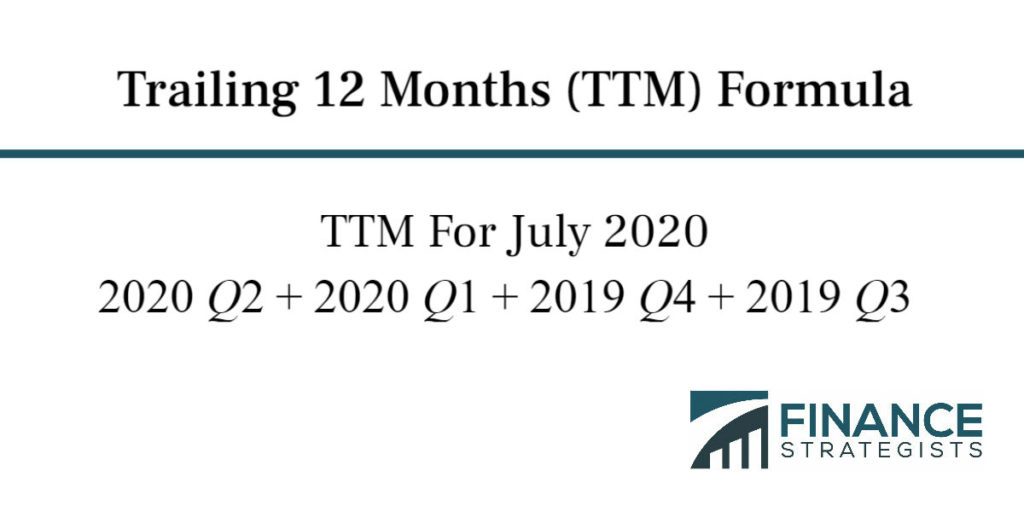
TTM Formula
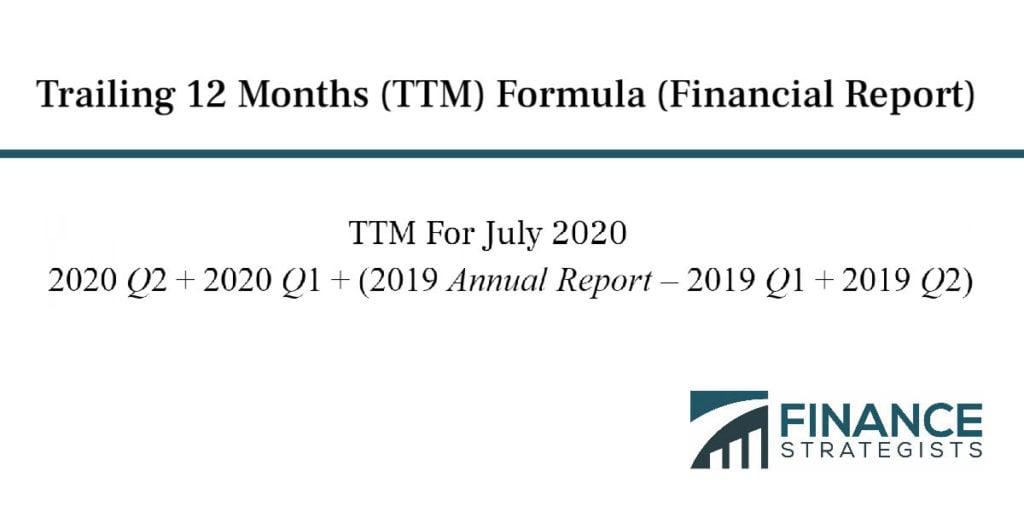
Advanced TTM Formula for Financial Reporting
EPS & TTM (Earnings per Share & Trailing Twelve Months)
TTM Conclusion
Trailing 12 Months FAQs
TTM stands for Trailing Twelve Months.
Trailing Twelve Months is a phrase used to indicate the previous 12 consecutive months of a company’s financial data, leading up to the time that a report of that data is generated.
Analysts often utilize TTM data as it is the best way to take an annualized view of the performance of a company over a sustained period of time.
Companies often use running TTM tallies to perform internal financial evaluations.
The prior fiscal year may be used instead of the trailing twelve months, but using the trailing twelve months allows for more up-to-date financial metrics.
True Tamplin is a published author, public speaker, CEO of UpDigital, and founder of Finance Strategists.
True is a Certified Educator in Personal Finance (CEPF®), author of The Handy Financial Ratios Guide, a member of the Society for Advancing Business Editing and Writing, contributes to his financial education site, Finance Strategists, and has spoken to various financial communities such as the CFA Institute, as well as university students like his Alma mater, Biola University, where he received a bachelor of science in business and data analytics.
To learn more about True, visit his personal website or view his author profiles on Amazon, Nasdaq and Forbes.