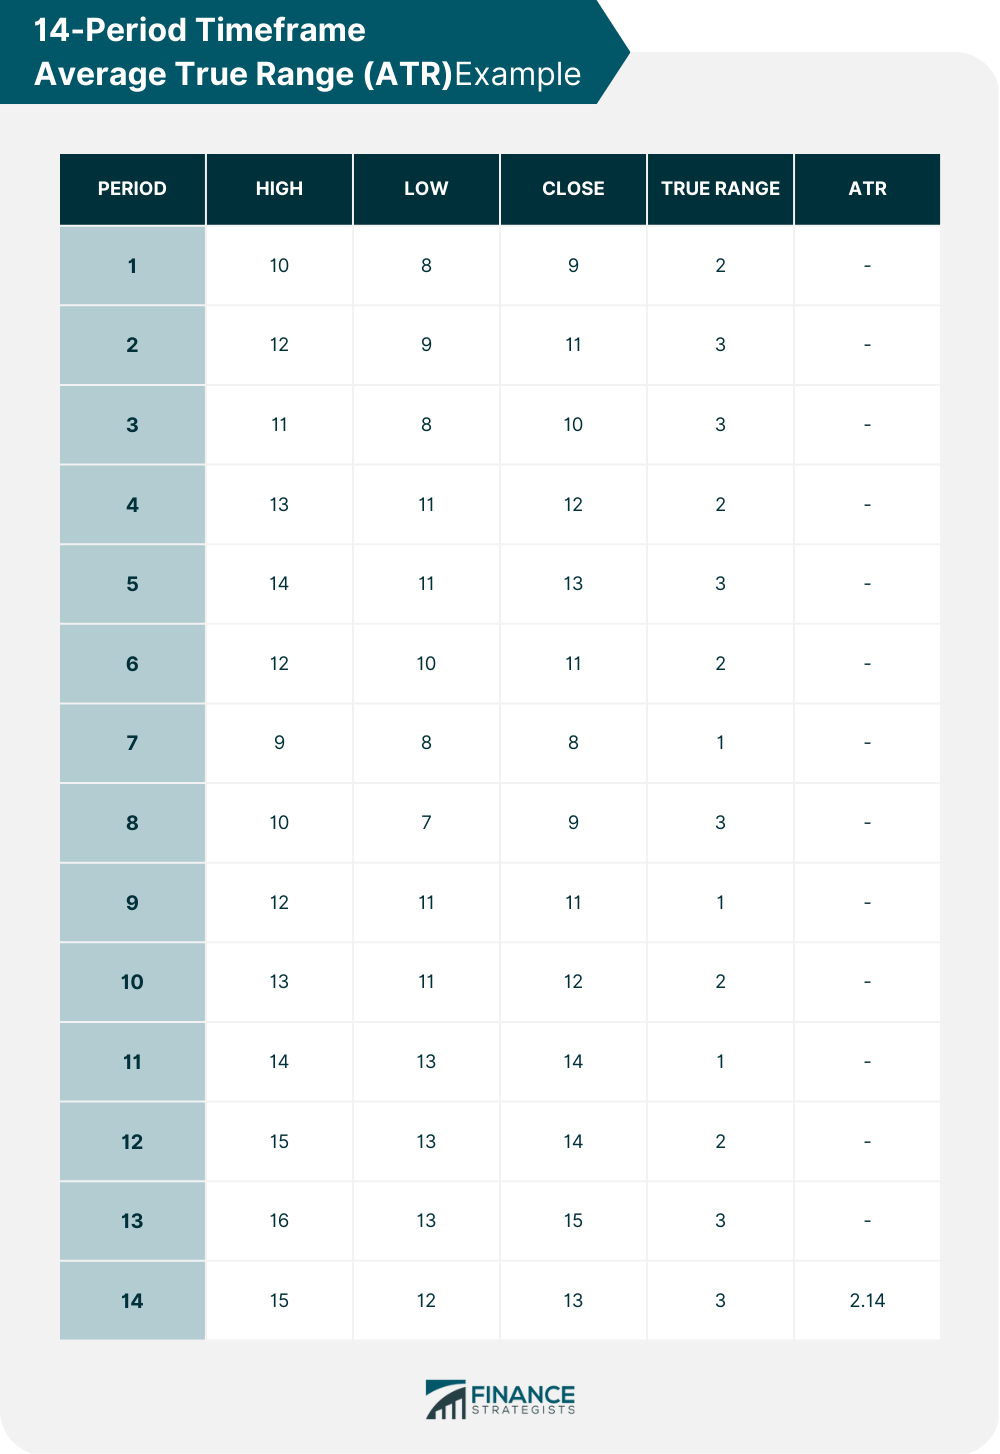
The Average True Range (ATR) analyzes the price range of an asset over a specified period of time, and serves as a technical analysis indicator that measures its volatility. ATR was developed by J. Welles Wilder and was first introduced in his book New Concepts in Technical Trading Systems in 1978. It is one of the widely used technical indicators among traders and investors. The ATR is the average of the true ranges over a given period of time. It is an important tool in technical analysis as it helps traders and investors assess a trade's potential risk and reward. By measuring the volatility of an asset, it can be used to set stop-loss levels, determine position size, and identify potential trend reversals or confirm the strength of a trend. To calculate ATR, it is important to first understand the concept of true range. The true range is simply the greatest of the following three values: Difference between the current high and the current low Absolute value of the difference between the previous close and the current high Absolute value of the difference between the previous close and the current low Once the true range is determined for each period, the average of these values is calculated over a specified period of time. The most commonly used period for ATR calculation is 14 periods, but this can be adjusted to suit individual preferences and trading styles. An example of ATR calculation over a 14-period timeframe is shown below: In the above example, the true range is calculated for each period using the formula outlined earlier. Once the true range for each period is determined, the average of these values is calculated over the specified 14-period timeframe to arrive at the ATR value. In this example, the ATR value for period 14 is 2.14. ATR is primarily used to determine the potential volatility of an asset. A higher ATR value suggests higher volatility, while a lower ATR value suggests lower volatility. This information can be useful in setting stop-loss levels or determining the size of a position. ATR can be used to determine the average range of price movement for a particular asset over a given period of time. By analyzing the ATR value, traders and investors can get an idea of how much the price of the asset is likely to move in the near future. This can be particularly useful for traders who want to avoid trading in excessively volatile markets, as it can help them identify periods of higher or lower volatility. Stop-loss levels are a key component of risk management in trading. A stop-loss order is placed with a broker to automatically sell an asset if it falls below a certain price level, limiting potential losses. The ATR value can be used to set a stop-loss level that takes into account the volatility of the asset. For example, a trader might set a stop-loss level at two times the ATR value, meaning that they would exit the trade if the price falls by more than twice the average daily range. The ATR value can also be used to determine the appropriate size of a position. By using the ATR value to calculate the potential risk of a trade, traders can adjust their position size to ensure that they are not risking more than they can afford to lose. For example, if the ATR value is $2 and a trader is willing to risk $100 on a trade, they would limit their position size to 50 shares. ATR can also be used to identify potential trend reversals or confirm the strength of a trend. A sudden increase in ATR may indicate a potential trend reversal, while a sustained increase in ATR over time may indicate a strong trend. The following are examples of ATR and its application: Assume that a trader wants to buy stock XYZ and has a trading account with $10,000. Based on their risk management strategy, they have determined that they are willing to risk 2% of their account on this trade. They decide to use ATR to determine the appropriate position size. The ATR for stock XYZ is currently $1.50. Therefore, the trader calculates that they can risk $200 on this trade ($10,000 x 0.02 = $200). To determine the appropriate position size, they divide their risk by the ATR: $200 / $1.50 = 133 shares. Therefore, the trader would buy 133 shares of stock XYZ. Assume that a trader is monitoring the price of stock ABC, which has been in a downtrend for the past several weeks. The trader notices that the ATR for stock ABC has been steadily decreasing over this period. However, they also notice that the ATR has suddenly increased significantly in the past few days. This sudden increase in ATR may indicate a potential trend reversal, and the trader may consider taking a long position in stock ABC. Assume that a trader has taken a long position in stock XYZ, which has a current price of $50. Based on their analysis of the ATR, they have determined that the appropriate stop-loss level is two times the ATR value below the entry price. The ATR for stock XYZ is currently $2. Therefore, the trader would set their stop-loss order at $46 ($50 - (2 x $2) = $46). If the price of stock XYZ falls to $46 or below, the stop-loss order will be triggered, limiting the potential loss on the trade. Here are some advantages of ATR: Provides a Measure of Volatility. ATR provides a measure of the volatility of an asset over a given period of time, which can be useful for traders and investors in making informed decisions about risk management and position sizing. Easy to Calculate. ATR is easy to calculate and is widely available on most trading platforms and charting software. Useful for All Types of Markets. ATR can be used in all types of markets, including stocks, commodities, and forex. Customizable Period. The period over which ATR is calculated can be customized to suit individual preferences and trading styles. While there are benefits to ATR, there are also limitations. Here are some: Historical Data Bias. ATR is based on historical price data and may not necessarily reflect future market conditions. Does Not Predict Direction. ATR does not provide information about the direction of price movement, only the magnitude of potential price movements. May Be Affected by Outliers. ATR can be affected by outliers, which can skew the average range of price movement. Not Suitable for All Strategies. ATR may not be suitable for all trading strategies and should be used in conjunction with other technical indicators and analysis techniques. ATR is an important tool in technical analysis that can be used to measure the volatility of an asset and assist traders and investors in making informed decisions about risk management, position sizing, and identifying potential trend reversals or confirming the strength of a trend. By understanding the calculation and interpretation of ATR, traders, and investors can use this powerful tool to their advantage in the financial markets. While ATR has its limitations, it remains a popular and widely used technical indicator that can provide valuable insights into market conditions. Consider speaking with a wealth management professional for guidance on how this concept can be useful in your investments.What Is Average True Range (ATR)?
Calculation of ATR
Interpretation of ATR
Using ATR to Determine Market Volatility
Setting Stop-Loss Levels Based on ATR
Determining Position Size Based on ATR
Using ATR to Identify Potential Trend Reversals or Confirm the Strength of a Trend
Examples of ATR in Use
Example of Using ATR to Determine Position Size in a Long Trade
Example of Using ATR to Identify Potential Trend Reversals in a Downtrend
Example of Using ATR to Set Stop-Loss Levels in a Volatile Market
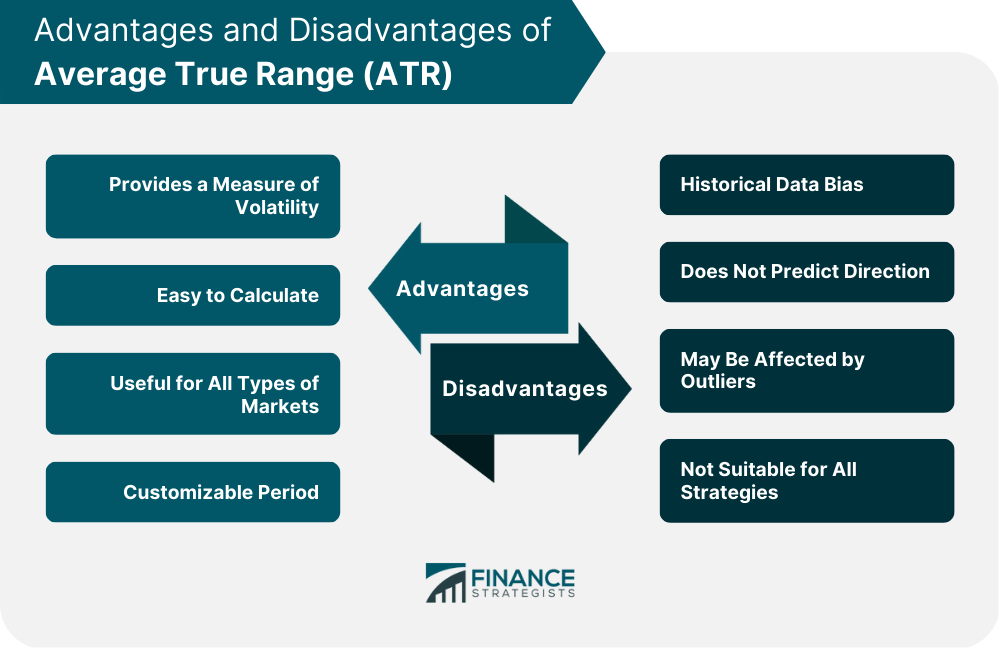
Advantages of ATR
Disadvantages of ATR
Final Thoughts
Average True Range (ATR) FAQs
ATR is a technical analysis indicator that measures the volatility of an asset. It is calculated by taking the average of the true ranges over a given period of time. The true range is the greatest of the following three values: the difference between the current high and the current low, the absolute value of the difference between the previous close and the current high, or the absolute value of the difference between the previous close and the current low.
ATR is primarily used to determine the potential volatility of an asset, which can be useful in setting stop-loss levels or determining the size of a position. Traders may also use ATR to identify potential trend reversals or to confirm the strength of a trend.
Yes, ATR can be used in all types of financial markets, including stocks, commodities, and forex.
ATR provides a measure of volatility, is easy to calculate, and is customizable to suit individual preferences and trading styles. It can be useful in making informed decisions about risk management, position sizing, and identifying potential trend reversals or confirming the strength of a trend.
ATR is based on historical price data and may not necessarily reflect future market conditions. It does not predict the direction of price movement, only the magnitude of potential price movements. ATR can be affected by outliers, and it may not be suitable for all trading strategies.
True Tamplin is a published author, public speaker, CEO of UpDigital, and founder of Finance Strategists.
True is a Certified Educator in Personal Finance (CEPF®), author of The Handy Financial Ratios Guide, a member of the Society for Advancing Business Editing and Writing, contributes to his financial education site, Finance Strategists, and has spoken to various financial communities such as the CFA Institute, as well as university students like his Alma mater, Biola University, where he received a bachelor of science in business and data analytics.
To learn more about True, visit his personal website or view his author profiles on Amazon, Nasdaq and Forbes.