
Cost of goods sold is the direct cost incurred in the production of any goods or services. This includes direct labor cost, direct material cost, and direct factory overheads. It does not include indirect expenses, such as sales force costs and distribution costs. Let us say that you are selling bath soaps. To produce a bath soap, your company has to spend approximately $5 per soap on ingredients such as soap base, fragrance, and additives. You also have to spend $1 per bath soap on the labor required to craft it and $1 for packaging. So, your company is spending a total of $7 to create the soap. The ideal selling price should be at least greater than $7 to make a profit since it needs to account for both COGS and the additional indirect costs like marketing and shipping. Lowering COGS is one way to increase the gross profit of your company since COGS are variable costs. If your company can find other suppliers of soap ingredients that you can only spend $4 on ingredients per bath soap, then the COGS will be reduced to $6 per bath soap. With the same selling price of bath soap, this helps your company increase your margin without jeopardizing quality. This relationship portrays how COGS is used to assess how efficient the company is in managing its supplies and labor in production. There are also some cases that businesses, specifically service companies, do not have COGS and inventories, thus, no COGS are displayed on their respective income statements. Subscribe to the Finance Strategists YouTube Channel ↗ COGS shows the expenses incurred in producing the goods over a certain period of time. The formula for COGS is: Let us say XYZ Company wants to calculate COGS in the first quarter of 2022. If the company has a beginning inventory of $30,000 and the purchases totaled $12,000 for that quarter, and the ending inventory is $8,000, then the total COGS of XYZ Company for that quarter will be: COGS = $30,000 + $12,000 – $8,000 = $34,000 Thus, the total COGS in the 1st quarter of 2022 is $34,000. The calculation for COGS depends on the inventory costing method used by a company. The IRS has set specific rules for which type of method a company can use and when to make changes to the inventory cost method. There are four methods that a company can use when recording its inventory sold during a period. The FIFO method presupposes that the first goods purchased are also the first goods sold. This assumption is closely matched to the actual flow of goods in most companies. For instance, a company purchased 100 items for $15 each for the 1st quarter of 2022, then purchased 100 more items for $20 each. The company sold 80 items in this accounting period. Using the FIFO method, COGS for each of the 80 items is $15/item because the first goods purchased are accounted to be the first goods sold. For the 120 remaining items in inventory, the value of 20 items is $15/item, and the value of 100 items is $20/item. In typical economic situations where inflationary markets and rising prices occur, the oldest inventory will theoretically be at lower prices than the latest inventory purchased at present inflated prices. This is the advantage of using the FIFO method because this lower expense will result in a higher net income. Additionally, the ending inventory is inflated because the latest inventory was purchased at higher prices. LIFO method records the most recent produced items as sold first. In this method, the cost of the latest products purchased is the first to be expensed as COGS. For example, a company has a beginning inventory of 250 items at $3/item. The company made the following purchases: If the company sold 400 items, the order of cost expenses would be: The COGS is identified with the last purchased inventories and moves upwards to the beginning inventories until the required number of items sold is fulfilled. For the sale of 400 items: The total COGS for the sale of 400 items is $2,300. This is calculated by adding $1,800 and $500. The unsold 430 items would remain on the balance sheet as inventory for $1,520. The average cost method uses a basic average of all similar items in the inventory, regardless of purchase date. The final inventory will then be counted at the end of an accounting period. When the company multiplies the average cost per item by the final inventory, it gives them a value for the cost of goods available for sale at that point. A similar average cost is also used for the number of items sold in the previous accounting period to reveal COGS. Assuming the inventory below from ABC Candles: ABC Candles sold 780 candles in the second quarter. The average cost is the total inventory purchased in the second quarter, $8,650, divided by the total inventory count from the quarter, 1000, for an average cost of $8.65. Hence, cost of goods sold is: COGS = 780 x $8.65 = $6,747 The cost of goods available for sale or inventory at the end of the second quarter will be 220 remaining candles still in inventory multiplied by $8.65, which results in $1,903. The special identification method utilizes the assigned cost of each unit of inventory or goods to calculate the ending inventory and COGS for a particular period. With this method, the business will know accurately which item was sold and its exact cost. This method is usually used in high-ticket products or those products that need a closely controlled inventory and track trends of sales. For instance, XYZ Jewels has the following transactions in June 2022. This can also be calculated simply by multiplying the number of pieces sold per jewel by its cost per unit and getting the total of all values (see column on the Amount of Inventory Sold Using Specific Identification Method). COGS and operating expenses are different sets of expenditures incurred by the business in running their day-to-day operations. They are recorded as different line items in the income statement, but both are subtracted from the revenue or total sales. Operating expenses are expenses that are indirectly tied to producing the goods or services. Selling, general, and administrative (SG&A) expenses are usually put under this category as a separate line item. Operating expenses include utilities, rent, office supplies, sales and marketing, legal costs, insurance, and payroll. Here are some main differences between COGS and operating expenses: COGS is a key performance indicator (KPI) that tells you how much it costs to produce your product. You will need to strategically find ways to reduce your costs so that you can improve your profitability. One way to reduce your COGS is to negotiate better prices from your suppliers. This is especially important if you are using a lot of raw materials in your production process. If you can get a lower price for the raw materials, it will directly impact your bottom line. Improving your bottom line also means finding ways to automate and streamline processes. This can help you reduce labor costs and increase efficiency. For example, if you are a manufacturing company, you may want to invest in machinery that can automate some of the production processes. While this may entail a higher initial investment, it can pay off in the long run by reducing your overall costs. Find ways to reduce or eliminate waste in your production process. This includes things like excess materials, defective products, and unused packaging. By reducing waste, you can save money and increase profits. COGS includes all the direct costs associated with producing a product or service. This includes raw materials, labor, and manufacturing overhead expenses. While COGS and operating expenses are different, they are both important in measuring the success of a business. Operating expenses help establish a budget for each department and evaluate the overhead costs spent by the company. COGS determines how profitable the product or service the company offers. COGS is an important metric to track in improving profitability. By understanding COGS, you can explore strategies, such as reducing costs, streamlining processes, and reducing waste, to improve your bottom line.What Is Cost of Goods Sold (COGS)?
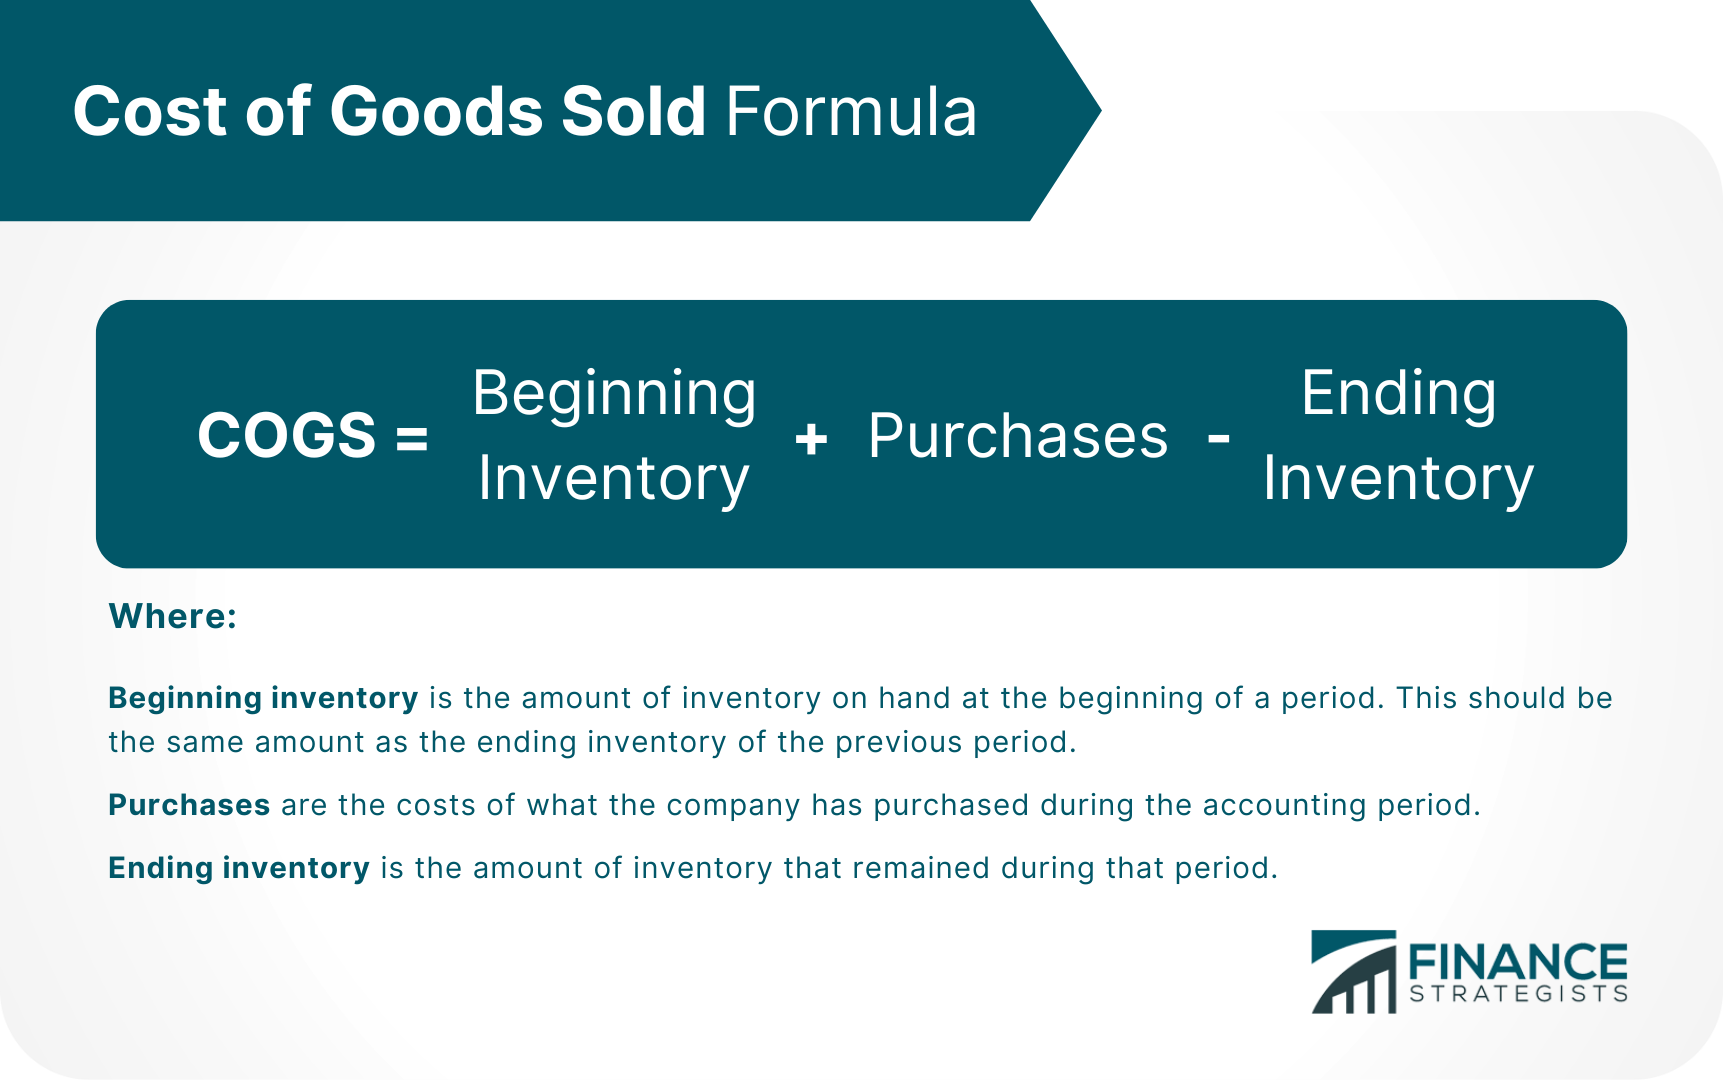
Cost of Goods Sold Formula
Calculating Cost of Goods Sold
Accounting Methods for Cost of Goods Sold
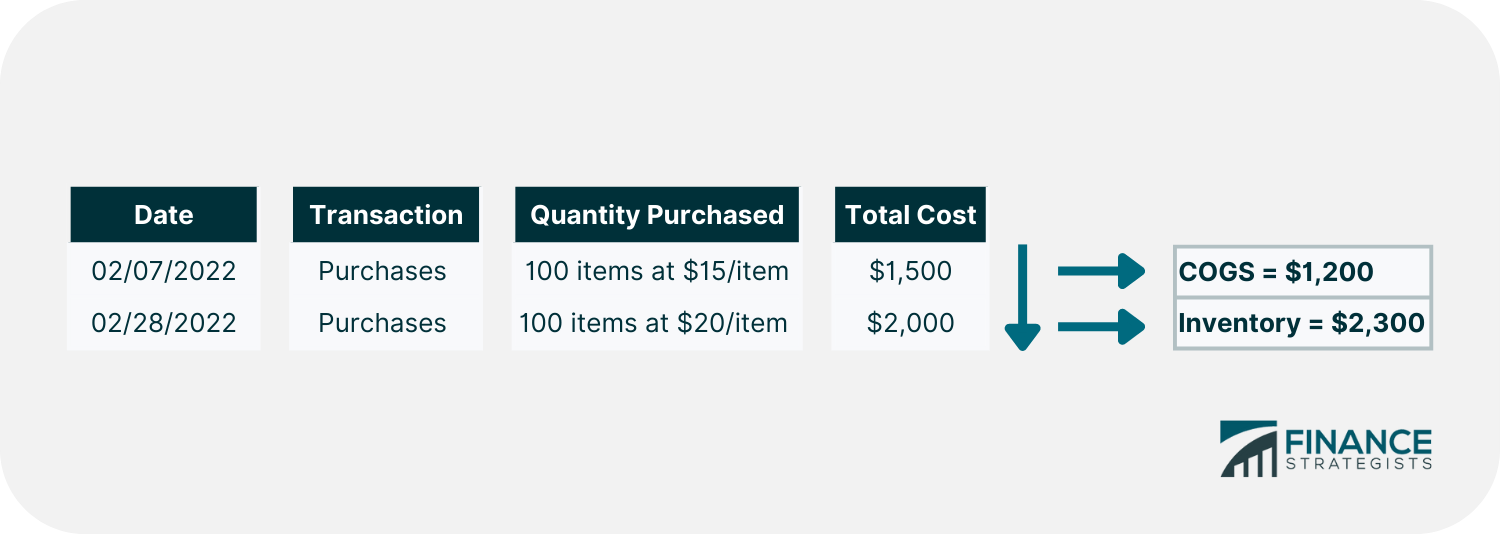
First-in-First-Out (FIFO)
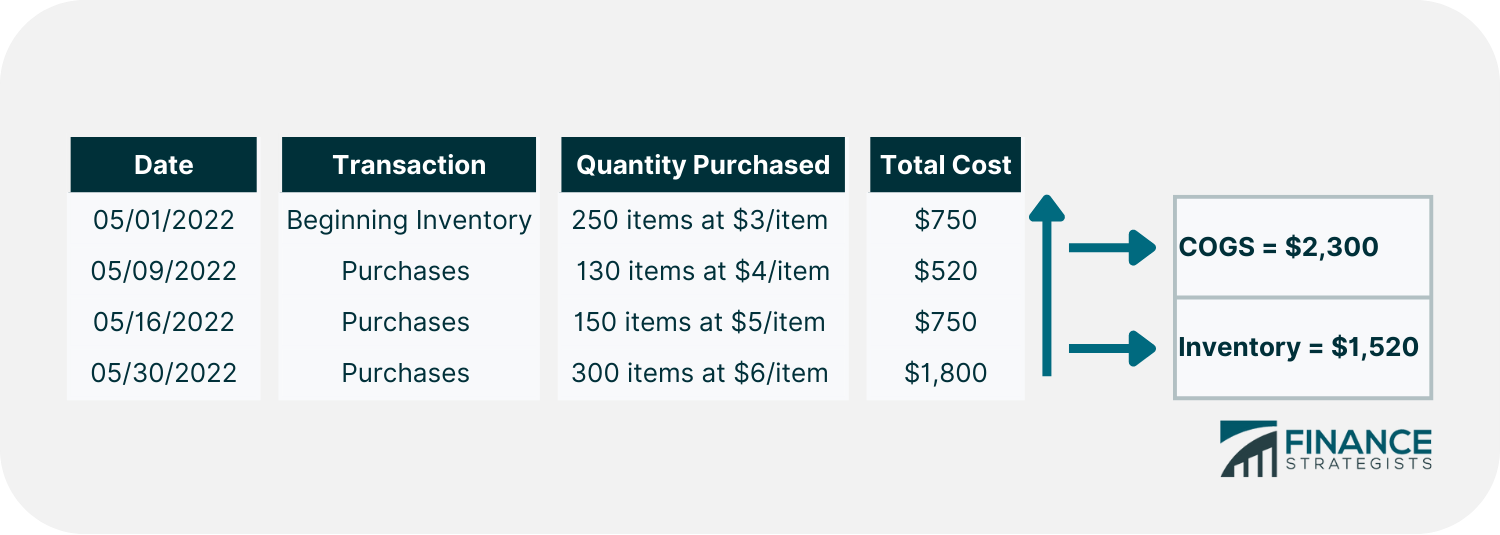
Last-in-First-Out (LIFO)
Average Cost Method
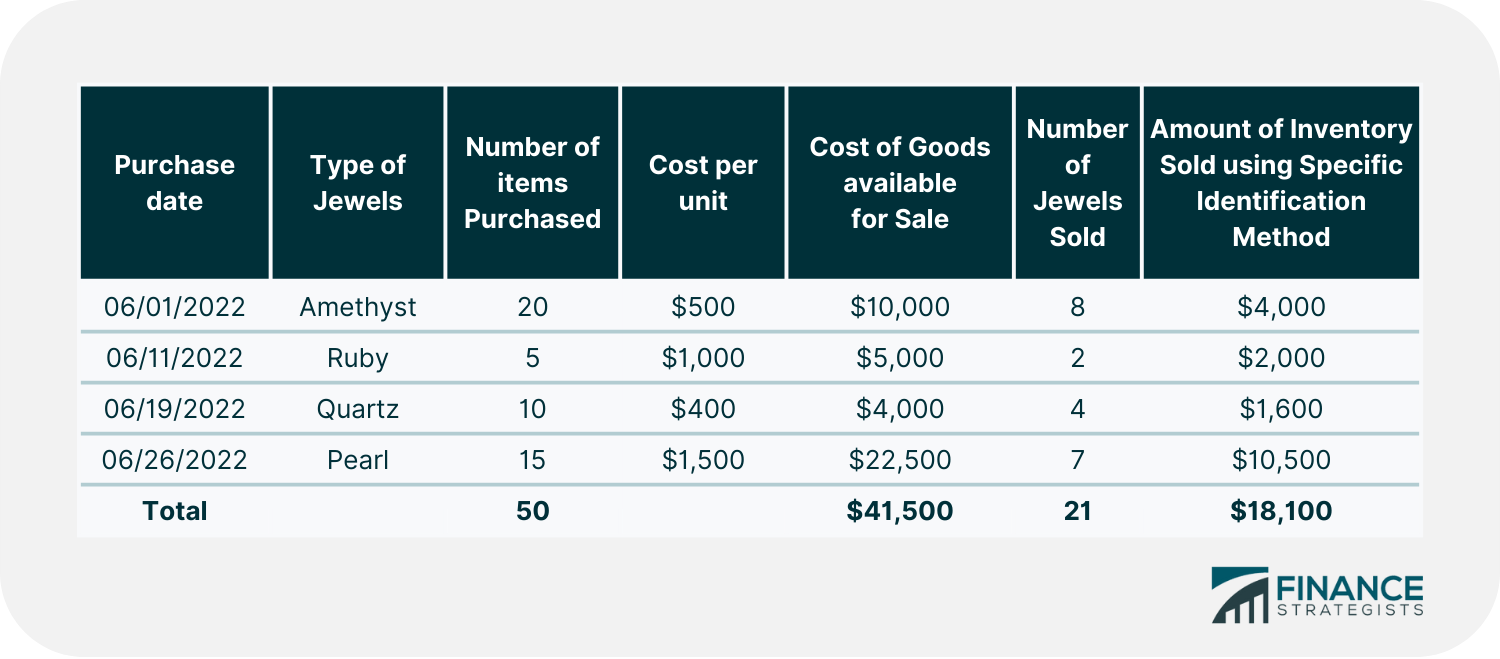
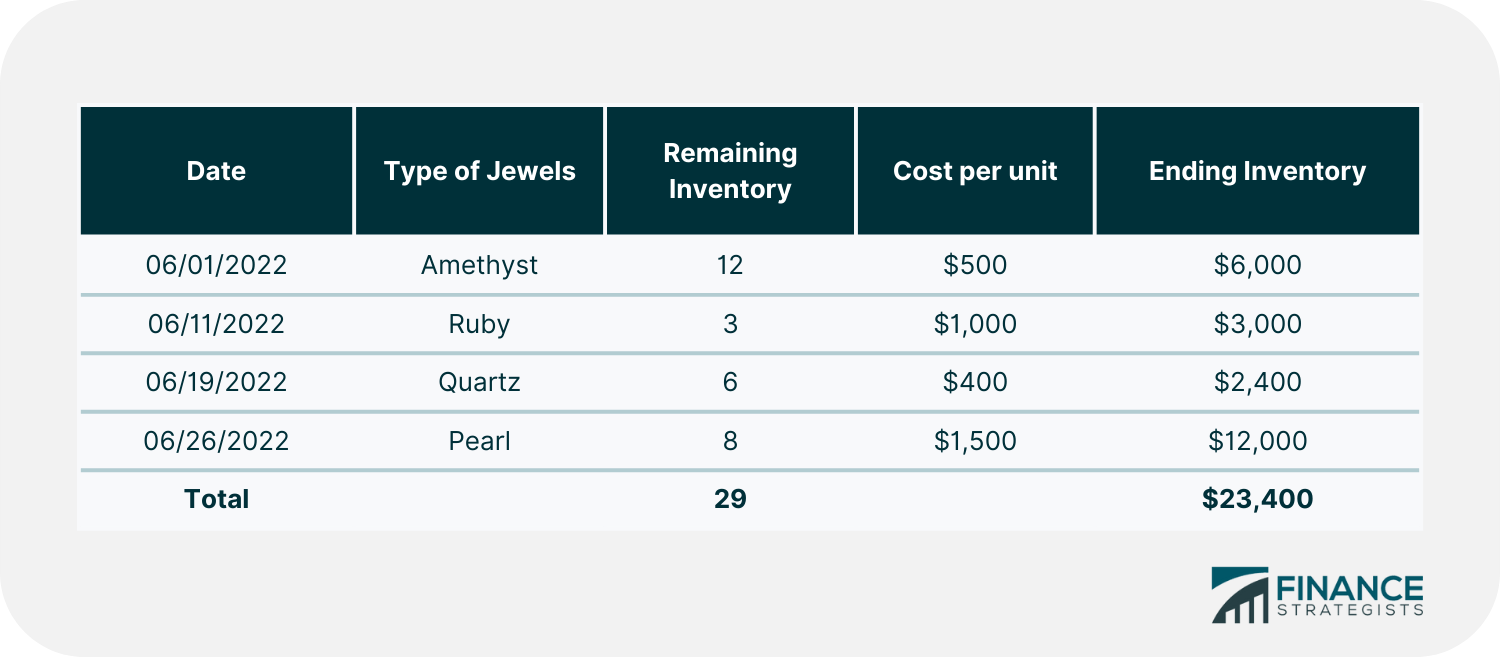
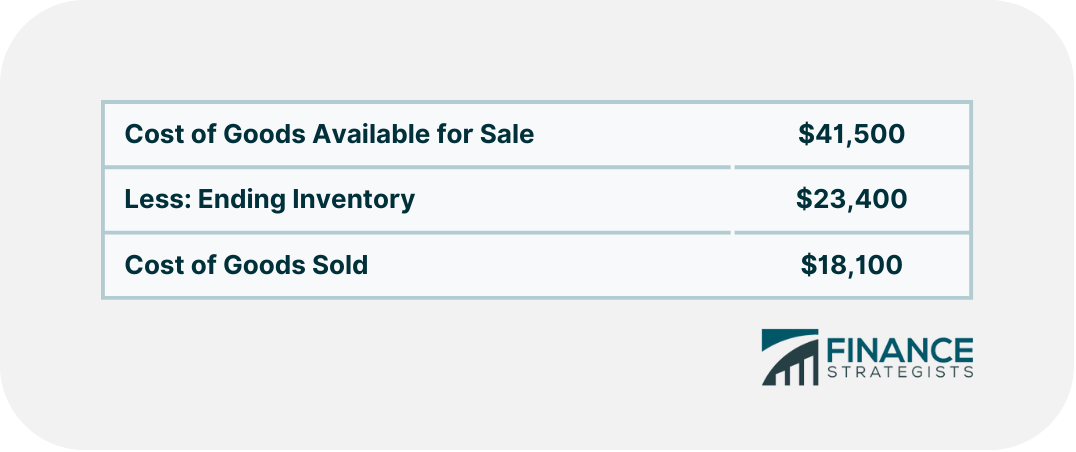
Special Identification Method
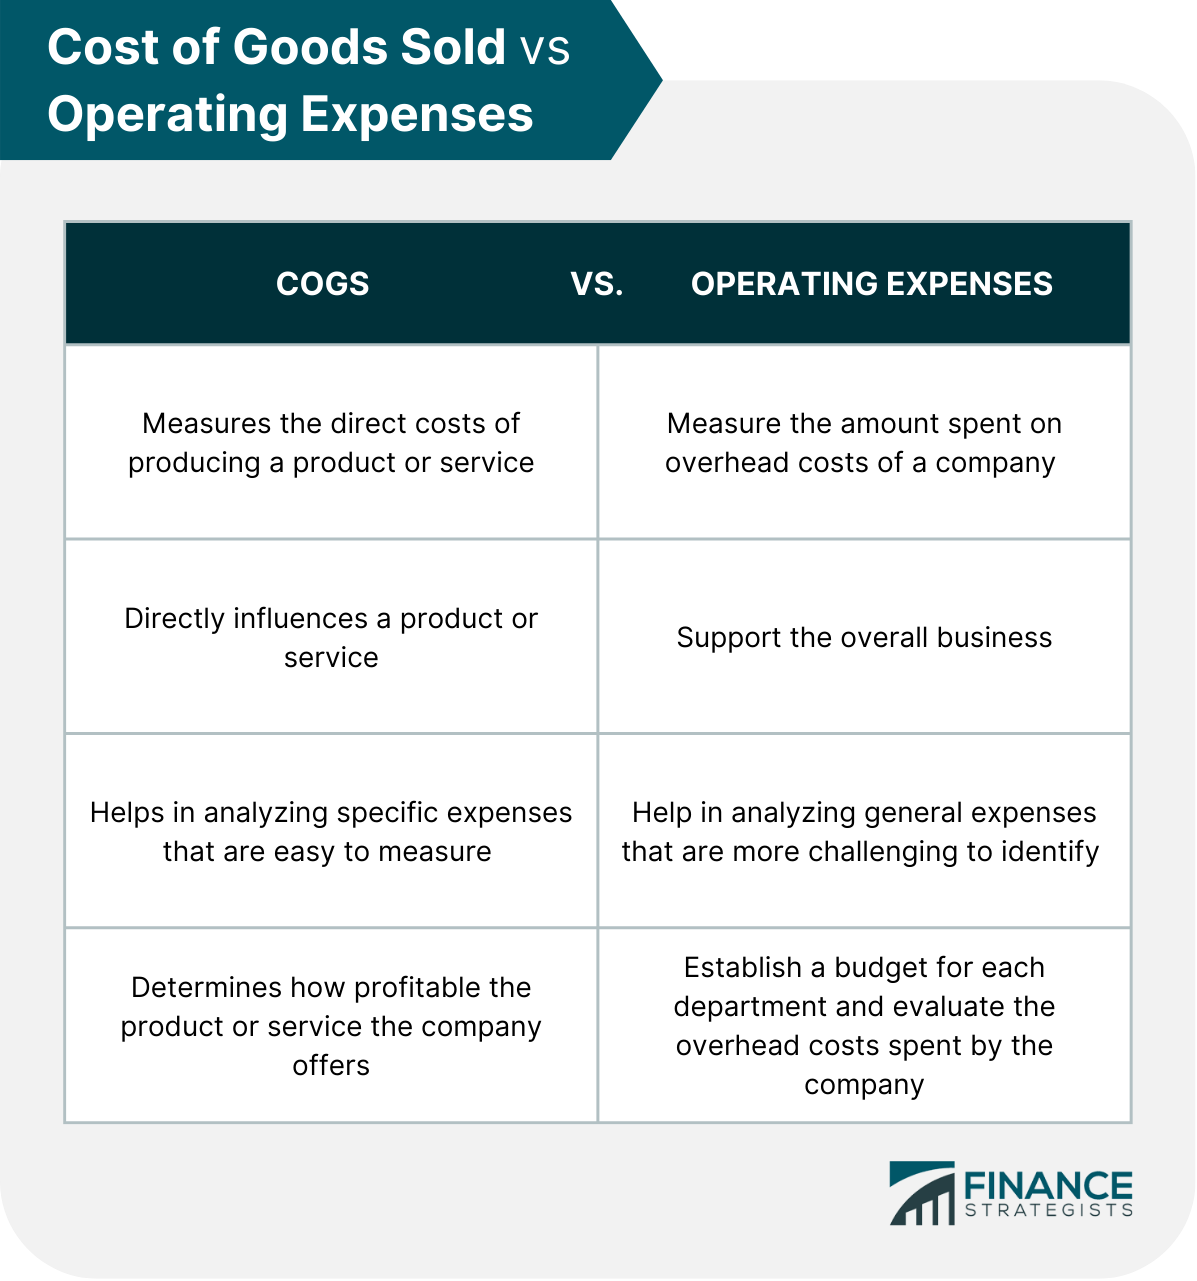
Cost of Goods Sold vs Operating Expenses
Using Cost of Goods Sold in Improving Profitability
Negotiate better prices from suppliers
Automate and streamline processes
Reduce waste
Final Thoughts
Cost of Goods Sold FAQs
The formula for COGS is: COGS = Beginning Inventory + Purchases - Ending Inventory
COGS includes all the direct costs associated with producing a product or service. This includes cost of materials, labor, and manufacturing overhead.
Cost of goods sold is the term used for manufacturers on their costs spent to produce a product. Cost of sales is typically used by service-only businesses because they cannot list COGS on their income statements. Examples of businesses using the cost of sales are business consultants, attorneys, and doctors.
Revenue is the total amount of money that a company brings in from sales, and COGS is the direct cost associated with those sales. If a company has high COGS, it means that it costs more to produce its product or service, which in turn may lead to lower profits. Conversely, if a company has low COGS, it means that it costs less to produce its product or service, which may lead to higher profits.
Salaries and other general and administrative expenses are not labeled as COGS. However, there are types of labor costs that may be included in COGS, provided that they are directly related to producing the primary product or service of the company. For example, if a company manufactures clothing, the salaries of sewers and cutters would likely be included in COGS, as they are directly involved in the production process. However, the salary of the CEO would not be included, as he or she is not directly involved in production.
True Tamplin is a published author, public speaker, CEO of UpDigital, and founder of Finance Strategists.
True is a Certified Educator in Personal Finance (CEPF®), author of The Handy Financial Ratios Guide, a member of the Society for Advancing Business Editing and Writing, contributes to his financial education site, Finance Strategists, and has spoken to various financial communities such as the CFA Institute, as well as university students like his Alma mater, Biola University, where he received a bachelor of science in business and data analytics.
To learn more about True, visit his personal website or view his author profiles on Amazon, Nasdaq and Forbes.


